
Geochemistry is Ground-Truth
For decades, determining the source of the hydrocarbons in your production stream has required complex geochemical models. The technological advances in computing power has advanced many production allocation models into the mainstream. These methods allow for robust statistical analyses to be conducted now in a fraction of the time.
DIG has a tool to define your unconventional drainage system. Charging a reservoir with oil and gas often requires networks of induced fracture networks to natural fault and fracture networks. These are the feeder networks that can define drainage of fluids in our system. Don’t get us wrong matrix porosity and permeability within the reservoir target is extremely important but the production of unexpected hydrocarbon geochemistry often leaves the geologists and engineers searching for drainage network answers.
The geochemistry of the hydrocarbon fluids is ground -truth. No matter what the geophysics might say about induced fracture networks and natural fault and fracture networks, the fluids don’t lie. If you understand the petroleum system, you often have a fundamental knowledge about source rock geochemistry. You can apply this knowledge to the production stream hydrocarbon geochemistry. Setting up end-member oils may or may not require expensive extraction of penetrated organic-rich source rock. In other words, you can start a successful production allocation mixing model.
Two, three and four end-member mixing models can be constructed. Actionable results are often achieved with simpler models. Un-mixing your production stream often provides valuable information regarding the extent of the induced completion technique and its communication with the natural fracture system. Answer the fundamental questions: How extensive is the drainage system? How does this affect the development strategy? These techniques provide important conclusions about well-spacing.
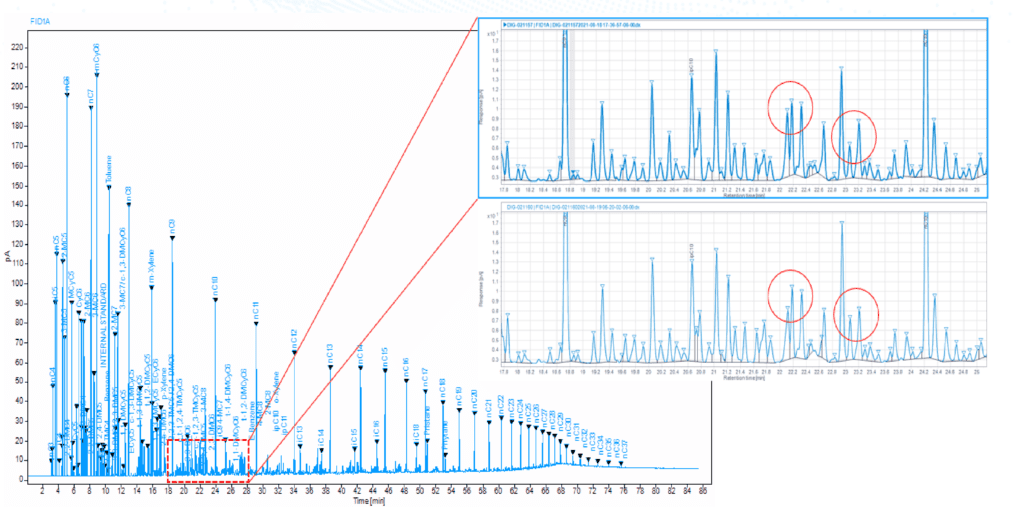
Gas Chromatogram

High Resolution Gas Chromatography
Send us a production oil and we will usually run high-resolution gas chromatography (HRGC) on that fluid. HRGC provides a tremendous amount of information about the composition of a very complex fluid. For example the distribution of the fully-saturated normal alkanes are seen on most chromatograms and resemble the back fin of Dimetrodon. We do not want to perpetuate the myth that oil comes primarily from dinosaurs, it’s mostly algae, plant and bacteria biota. Bulk geochemical composition might include the saturate, aromatic, resin and asphaltene components (SARA) of the oil. Some of the peaks on the HRGC chromatogram have been identified and some have not. Production oils from the same production stream can be remarkably consistent, or can change ever-so- slightly over time. This is especially true in unconventional development areas. Those slight changes are giving us important information about field drainage.
It is important to consider the geochemistry as it is presented in the HRGC. The drainage tank of a field or reservoir and, most importantly, access to drainage areas in an unconventional system results in changes in the contribution chemistry of the oil over time. Connection to networks that may contribute are susceptible to slight pressure depletion changes and will relate directly to the oil geochemistry changes that occur over time. In other words, access to certain areas may turn off, thereby changing the chemistry of the oil.
What a back fin!

The Allocation Technique
- Relies on height-ratios of neighboring peaks (includes unidentified, inter-paraffin peaks)
- Is calibrated using synthetic lab mixtures
- Numerically solves a set of mass balances for endmember mass fractions
- Weights importance of peak ratios based on variance between sample reps
A systematic, statistics-based mixing model that relies on WOGC peak height ratios was used for allocating production in this dataset (Nouvelle, et al., 2012). The mixing model uses height ratios between all neighboring peaks from normal paraffin C9 to C20 on the chromatogram, rather than only comparing a few manually selected peak pairs. Each ratio has its own linear mixing equation, which is given a weight in the overall model that is inversely proportional to the statistical variance of that ratio across sample repetitions. This allows for a characterization of mixed oils that depends more heavily on the highest quality ratios. That is, the ratios that best differentiate endmembers and have good repeatability. At least one synthetic mixture of endmember oils is required as an input for setting the overall mixing curve. Additional synthetic mixtures may be analyzed as unknowns to gauge the inherent uncertainty of the model.